By Ruben Gatt
August 2010
In this tutorial we show you how to create charts using the new DotNetMushroom RAD version 01.30.00.
The new version of DNM RAD provides a simple to use but advanced control to create charts in a DNM RAD application. We walk you through step by step how to create the source tables followed by a line chart, a bar chart and a pie chart.
Creating the Tables
Before we start to create the actual charts we first need to create the tables and fields from where the DotNetMushroom RAD control will get the data necessary to plot the charts.
In this example we will create a chart where we will compare the browsers popularity according to the www.w3schools.com website
Click Here for the statistics page
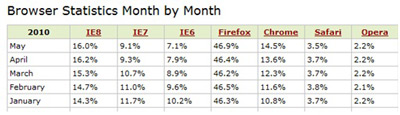
Screenshot of the statistics from w3schools.com
From this data we will create the following table as shown in the screenshot below:
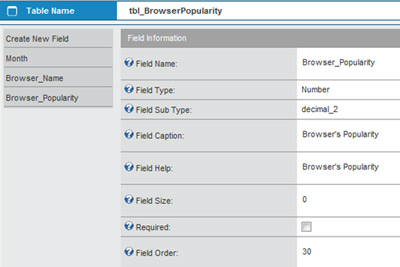
Screenshot of the table structure
The table which we have named tbl_BrowserPopularity consists of 3 fields:
Month – Text field
Browser Name – Text field
Browser Popularity – Number (decimal_2)
After the above fields have been created we can now create 2 forms, one form will be used to view a list of the data and another form will be used to input the data into the newly created database table as shown in the screenshot below.

Screenshot of the Data View form and the Data Entry form
Creating a Line Chart
Now that we have sufficient data to plot on our charts we can start by creating a line chart.
Create a new form which named “frm_BrowserPopularity”. We do not need to select a data source for this form unless we are going to display any other data besides the chart.
Next click on the form Templates tab and now we are going to add a control to the Body Template. If you click on the Control Type dropdown you will notice that there is a new control called
DNMCHARTS.
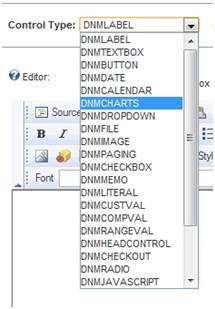
Screenshot of the new control DNMCHARTS
Add the new control to the Body Template and press the Save Template button.

Go back to the Properties tab where you should now see the newly created chart control. Click on the control to view its properties. Although it’s relatively easy to set-up a chart with a few clicks the control provides lots of advanced features and is very flexible and customisable.
Screenshot of the Chart control properties
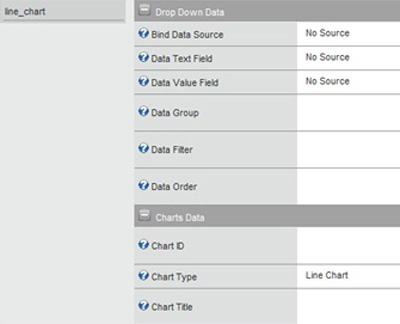
Select the table we have previously created (
tbl_BrowserPopularity) as the Data Source for the Control.
The next step is to select
Browser_Name as the Data Text Field and
Browser_Popularity as the Data Value Field.
For this example we are only interested in the statistics that correspond to the month of May so in the Data Filter field we use the column name of the month field which is
Month in order to filter the data for May i.e
Month = ‘May’
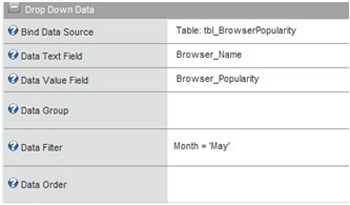
Screenshot of the Drop Down Data for the chart control
Now enter a
UNIQUE Chart ID in the Chart ID field under the Charts Data section and give the chart a title e.g. Browser Popularity.
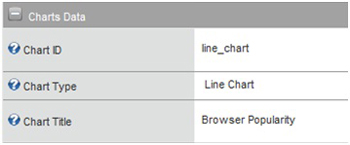
Screenshot of the Charts Data for the chart control
Finally press the
Save button. If we add a new DNM RAD module to our page and select the
frm_BrowserPopularity form we should now see our Line Chart.
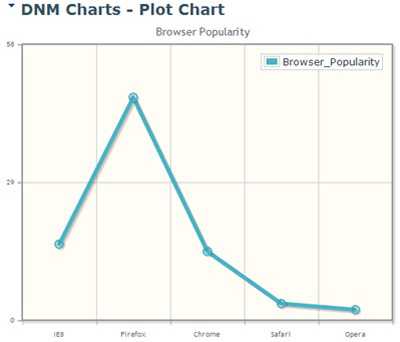
Screenshot of the Line Chart displaying only data from the month of May
So the above chart only shows the data for the month of May but what if we want to show the data of the month of April along with the data of the month of May, we only need to modify two fields within the chart’s properties.
First go to the form
frm_BrowserPopularity and access the properties of the chart control you have created.
Next change the properties of the control under the
Drop Down Data tab to look exactly like the screenshot below.
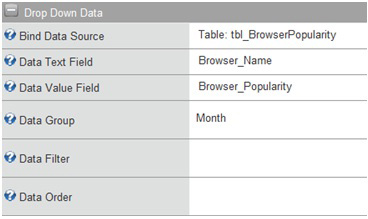
Screenshot of the properties of the chart control
Basically we removed the
Data Filter as we want to show the data of the month of May and April since we only have those records in the database. In case we have other months in our database we would modify the
Data Filter as follows:
Month IN(‘May’,’April’)
Then we use a
Data Group in order for the control to know by which column to Group the data. This will allow the chart to show either multiple lines in case a Line Chart is used or multiple bars in case a Bar Chart is used.
For this example the column
Month will be used to group the data by month.
Press the
Save button to save the properties of the control and then refresh the page where the chart is being displayed to reload the data.
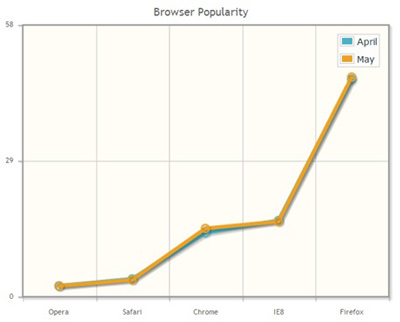
Screenshot of the Line Chart with data from the month of April and May
Creating a Bar Chart
We will now use the previous chart to create a bar chart. The steps to create a bar chart are exactly the same as the steps we followed to create a line chart, the only difference being is that the
Chart Type needs to be set to
Bar Chart instead of Line Chart.
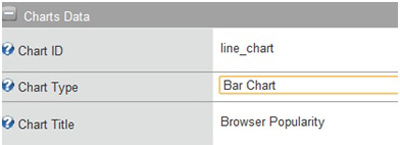
Screenshot of the chart properties for a Bar Chart
After the
Chart Type is set press the
Save button to save the chart properties.
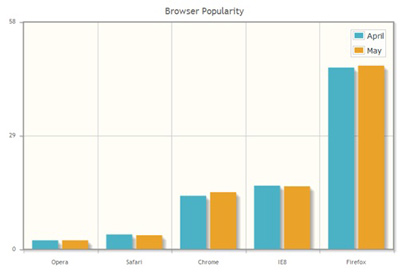
Once we have saved the properties of the chart we can refresh the page and you should now see a bar chart instead of a line chart representing the same information using the same data we inputted in the table
tbl_BrowserPopularity.
Screenshot of the chart properties for a Bar Chart
If the chart bars are too near each other modify the width of the chart as shown in the screenshot below.
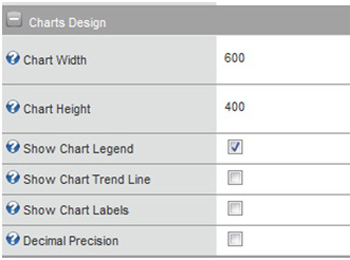
Screenshot of the chart control properties – Charts Design tab
You can also modify the width of the bars from within the
Bar Chart tab.
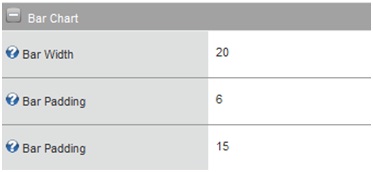
Screenshot of the chart control properties – Bar Chart tab
Creating a Pie Chart
The steps to create a line chart, a bar chart and a pie chart are practically the same but the difference is that a pie chart’s data cannot be represented the same way as a line and bar chart.
In fact the
Data Group field is obsolete when creating a pie chart as the data generated will not be correct for use with a pie chart, and we have to use a
Data Filter in some cases in order to get only the required and correct data.
So we modify the previous chart so that the
Chart Type is now set to
Pie Chart.
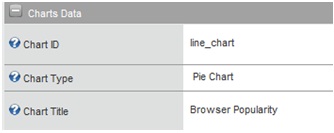
Screenshot of the chart control Charts Data tab
Next we need to modify the drop down data properties as follows, so that only data for the month of May is loaded:
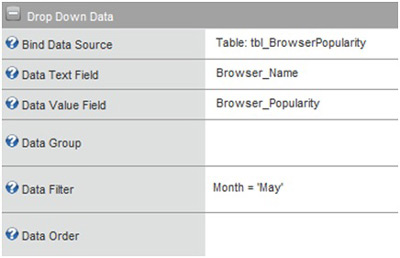
Screenshot of the chart control Drop Down Data tab
Finally press the
Save button to save the control properties and refresh the page. The chart should look similar to the chart in the screenshot below.
If you have any problems working with the DNM RAD module you can visit the
DotNetMushroom Forums.
Comments